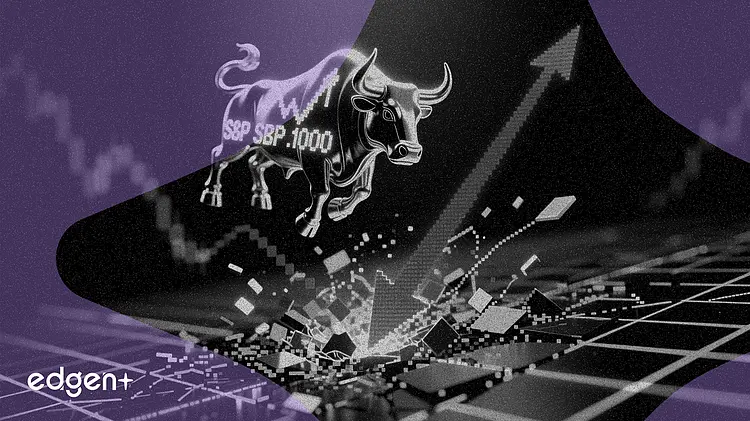
Key Takeaways:
- S&P 500 erased a 0.5% intraday gain and turned negative on June 12
- The index tested the weekly Gann Line near 7,385, a key support level
- A weekly close below 7,385 could open the door to a pullback toward 7,000
Key Takeaways:
The S&P 500 erased an intraday advance and swung into negative territory on June 12, testing a technical level that has determined the index's direction for months.
The benchmark index gave up a gain of as much as 0.5% in afternoon trading, slipping below the prior session's close as selling pressure broadened beyond technology stocks. The reversal left the S&P 500 hovering near 7,385, the weekly Gann Line that flipped from resistance to support in early May, according to Reuters technical analysis.
"The market is struggling to hold above a level that spent months acting as a ceiling," said Terence Gabriel, a market analyst at Reuters. "A weekly close below it would open the door to a deeper pullback toward 7,000."
The June 12 reversal followed two sessions of volatile price action. The S&P 500 closed at 7,386.65 on June 10 after a 0.26% decline that brought it back to the Gann Line, then bounced on June 11 as dip buyers stepped in. The inability to sustain gains above that threshold suggests the support level is fraying after multiple tests since mid-May.
Sector Rotation and Breadth
All 11 GICS sectors participated in the afternoon selloff, with technology and consumer discretionary names leading the decline. The Nasdaq 100 fell as much as 1.3% during the session, extending a tech-sector pullback that began after the June 4 peak in semiconductor stocks. The Philadelphia Semiconductor Index dropped more than 2% at its session low, with Marvell Technology giving back some of its post-Computex gains ahead of its June 22 S&P 500 inclusion date.
Defensive sectors offered little shelter. Utilities and consumer staples, which had outperformed during the prior week's selloff, also turned negative in the final hour. The advance-decline ratio on the New York Stock Exchange fell below 1-to-3, indicating broad-based selling rather than sector-specific rotation.
Cross-Asset Context
The equity reversal coincided with a backup in Treasury yields. The 10-year U.S. Treasury yield rose 4 basis points to 4.54%, extending its climb from the June 9 low near 4.47%. Higher discount rates pressure equity valuations, particularly for long-duration growth stocks that have led the 2026 rally.
The U.S. dollar index held near 100.04, little changed on the session, while gold edged higher to $4,144 an ounce as some investors rotated into haven assets. West Texas Intermediate crude fell 2.7% to $87.60 a barrel, adding to pressure from energy sector weakness.
What's at Stake
The S&P 500's inability to hold gains at the Gann Line raises the stakes for the weekly close on June 13. A finish below 7,385 would mark the first weekly close beneath that level since early May, when the index broke above it and rallied to a record intraday high near 7,620. The next support below 7,385 sits at the rising 10-week moving average near 7,300, followed by the 7,000 round number.
The June 13 close will also determine whether the index can avoid a third consecutive weekly decline, a pattern that has historically preceded corrections of 5% or more. The Cboe Volatility Index, which rose 6% to near 21 during the afternoon selloff, reflected growing demand for downside protection.
The next major catalyst on the calendar is the June 18 Federal Reserve decision, where markets will watch for updated dot-plot projections and Chair Jerome Powell's assessment of the growth and inflation outlook.
This article is for informational purposes only and does not constitute investment advice.